As much as I'd like to pretend to be one, I'm not a real photographer. Photographs are secondary to the experience - travel, laughter, people and memories. But sometimes I do give in and take a photo which requires patience, time and often, post-processing. Saturday night, I decided to prepare, polish and publish one of those.
Basic Tools: For stitching images the workflow involves three tools Hugin, autopano-sift and Enblend. All these tools are available with most popular distributions - apt-get install should do just fine.
The input to the tools are six photos taken with my trusty SD450. They have been taken with nearly identical modes with a Manual setting to prevent the camera from adjusting between pictures (forgot to turn off auto white-balance for this set). The camera has a panorama mode which allows me to fairly accurately align multiple pictures with enough overlap, but that's not really as useful as you might think.
Autopano: First step in creating panoramas is to identify common points. Autopano is an automatic image analysis tool which can identify common areas between photos. The command autopanog should get you the UI required to load all the photos. Other than checking absolute paths, there is nothing else that I found useful to tweak there. Autopano after computation throws out a .pto file which is then pushed onto the next tool.
Hugin: Hugin does all the further magic. After loading in the PTO file, select the image required to be the anchor or reference image of the panorama and anchor that image for position. It does really help if the horizon is horizontal for that picture. Thankfully, Hugin can actually read the EXIF data from the images to obtain information about the lens, field of view and other details which I wouldn't know how to provide. The next tab shows the data gathered by autopano in an editable view, to adjust the control points if required.
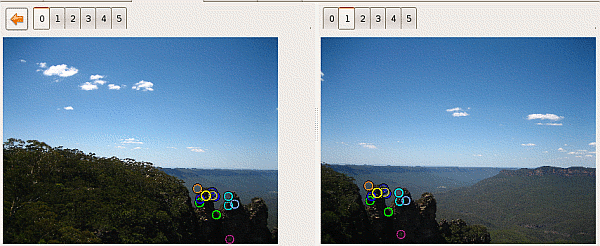
Rather than waste much time there, head over to the next tab and click on Optimize now!. It should result in Hugin working most of its miracles, in mysterious ways to perform, by realigning shearing and doing all the other important things required. About time, we got a preview of whatever is going to be the result. One of the curious behavioural defects of the tool is that the preview does not update unless manually initiated. I've wondered a couple of times about why the picture looks exactly the same whatever I do. But here's how it looks right now.

As it is very obvious, the camera's vignetting comes into play for the corners of all the images. Merely placing the layers above each other will not produce a satisfactory panorama. Therefore, rather than combine images inside Hugin, the output from this phase has to be the correspondingly distorted seperate images. So in the last tab, calculate the field of view, the optimal size and select the "Multiple TIFF" (cropped) output option. This gives us individual images which look somewhat like these (hmm... my ICC settings are off in these screenshots).

Enblend: Enblend does exactly what its name suggests. It can blend between images, performing a smooth transition between the frames to create a good looking panorama. Merely pass in all the images in order via the command like to enblend and it does the job neatly (but watch your CPU load). The blended image is not equirectilinear and requires cropping to create a rectangular image. Mine threw out a whoppingly large 161 MB uncompressed TIFF (12335x3438) file. After scaling it down, converting to JPG and re-inserting EXIF data, the image is ready for the world to see.

And that's the way it's done - only five months too late :)
--Just because you can explain it doesn't mean it's not still a miracle.
-- Terry Pratchett, Small Gods
posted at: 09:11 | path: /tutorials | permalink |
The first lines of this was written around seven months ago, when I was itching to get a proper article published with the stuff I've learned over the last four years. Working on the dotgnu unroller, APC and debugging random bits of code had turned me into a gdb power user. Sure, there's lots I don't know about gdb and most of what I talk about is stuff you can read right off the man page. But, even these I had to learn the hard way and I wanted to get this out to the world in one compact vehicle. Here's the part1 or the so-called duh! component of the four-part tutorial.
Segfaults: No, this is not for developers. Any and everytime I've reported a segfault to a developer, the first thing they ask for is a backtrace. To put it simply, a backtrace is a log of all the calls leading up to the segfault and is invaluable when dealing with most segfaults, be it bad arguments, corner case inputs or plain stupidity (of the user, developer or even his counterpart on the server side). Getting a backtrace out is the step #1 for any bug report. But before that, you've got to figure out how to run the errant program inside gdb.
bash$ gdb ./sig11

(gdb) run argument1=0 argument2=1 file1 file2 ...
That starts off the program in gdb. Now, you can continue to make the program crash by doing whatever you were doing before.
Program received signal SIGSEGV, Segmentation fault.
0x0000003c2fe6f200 in strlen () from /lib64/tls/libc.so.6
(gdb)
To get a backtrace out of it is just the matter of a single command bt
(gdb) bt
#0  0x0000003c2fe6f200 in strlen () from /lib64/tls/libc.so.6
#1  0x000000000040054d in foo (a=0x0) at test.c:5
#2  0x000000000040058a in main () at test.c:9
But often, distros like ubuntu and fedora, ship binaries without any debug info, to save on install space. If you are debugging something real, better look for a package that says -debuginfo. Or if you were building your own programs, compile them with the -g flag (gcc -g test.c).
There are variants of backtraces. You can provide backtrace with a count or even can ask it to be more verbose about the induvidual frames (every method call occupies a frame, unless it is a recursive tail call ... *blink* *blink*). For example, I could run bt full to print out the locals in the ancestor functions directly.
(gdb) bt full
#0  0x0000003c2fe6f200 in strlen () from /lib64/tls/libc.so.6
No symbol table info available.
#1  0x000000000040054d in foo (a=0x0) at test.c:5
No locals.
#2  0x000000000040059f in main () at test.c:11
        xyz = 0x4006b3 "abc"
        template = "abc"
Frames: Frames need more exploring in most cases. The recent debug symbol version, embed the entire code in the function. The key commands to play around with are frame or f for short and the list command. Both of these combined, empowers the user to see the code that went into the binary.
(gdb) f 2
#2  0x000000000040059f in main () at test.c:11
11              foo(NULL);
You can move up and down the frame using the up and down commands.
Now, just seeing the obvious culprit might not have been enough. You might want to see code around the actual call to decide the error condition. That's where list really kicks in.
(gdb) list
6       }
7       int main()
8       {
9               const char * xyz = "abc";
10              const char template[] = "abc";
11              foo(NULL);
12      }
Actually, you can list arbitrary lines of code too. This is just too good for debugging a huge file of code. For example, if I wanted to see what's at line 1 of the file.
(gdb) list test.c:1
1       #include &glt;stdio.h>
2
3       int foo(char * a)
4       {
Frame info: The frame info commands let you look at the arguments and local variables quickly. Unfortunately, if your code modifies the arguments along the way, you'll just see the new value, especially on AMD64 and other places where there are enough registers to pass around arguments.
(gdb) info locals
xyz = 0x4006b3 "abc"
template = "abc"
(gdb) info args
argc = 1
argv = (char **) 0x7fbffff858
Print: these are my favourite type of commands. Mainly because they print out information based on the inferred types and dump full structures. For example, here's a tidbit of print commands used on some ZendEngine2 (php) code.
(gdb) p h
$2 = (zend_file_handle *) 0x2a9a433540
(gdb) p *h
$1 = {type = 0 '\0', filename = 0x0, opened_path = 0x0,
      handle = {fd = 2, fp = 0x2, stream = {
      handle = 0x2, reader = 0x2a9a433548 <executor_globals+8>, closer = 0,
      fteller = 0, interactive = 1}}, free_filename = 104 'h'}
Now, this tells me way more than the average printf does. Especially, if I don't know what I'm looking for. But sometimes, you want some "processed" data out. Maybe the hex version of something or someone's mangled the name with a NUL prepend. So there's still a printf around.
(gdb) p src
$1 = (zend_function *) 0x7fbffff260
(gdb) printf "0x%02x\n", src->common.function_name[0]
0x00
(gdb) printf "%s\n", src->common.function_name+1
/opt/apc_test/var/www/html/apc.php
(gdb)
These are the basic commands I use to start off inspecting a coredump or other misbehaving programs. But there are a lot more you can do if you are debugging a live program. My next tutorial is about attaching a debugger to a program and the extra stuff you can do with the process. Breaking, watching and the works.
Watch this space.
--"The debugger is akin to giving the _rabbits_ a bazooka. The poor wolf doesn't need any sharper teeth."
-- Linus Torvalds, about NT's new debugger
posted at: 18:11 | path: /tutorials | permalink |