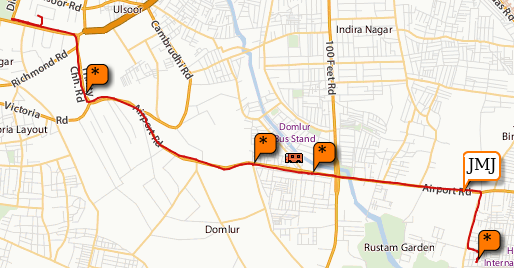
A few months back I bought myself a cycle - a Firefox ATB. For nearly two months before heading out to Ladakh, I cycled to work. One of those days, I carried yathin's GPS along with me. So yesterday night, I dug up the GPX files, out of sheer boredom (and inspired by one of shivku's tech talks). After merging the tracks and waypoints, I managed to plot the track on a map with the help of some javascript. Here's how it looks.

I have similar tracklogs from Ladakh, but they have upwards of 2000 points in each day, which do not play nicely with the maps rendering - not to mention the lack of maps at that zoom level. I need to probably try the Google maps api to see if they automatically remove nodes which resolve to the same pixel position at a zoom level.
I've put up the working code as well as the gpx parser. To massage my data into the way I want it to be, I also have a python gpx parser. And just for the record, I'm addicted to map/reduce/filter, lambdas and bisect.
--If you want to put yourself on the map, publish your own map.
