I've always used -fprofile-arcs to instrument and profile my code and often been quite unimpressed by the output verbosity or presentation clarity. My opnion about profilers were down in the dumps, till I ran into kcachegrind. That is really a killer application in terms of profiling code.
KCacheGrind has everything I need. It has call graphs, call counters, callee counters and even lets me view code with profiling data in place. The latter is quite a kick ass thing, really. Now, I could actually see what branch was taken what percentage of time, pre-compute branch conditions and basically understand how the code was being used.
But what are words when a picture could do more justice to the tool. The following picture is a source annotation of a bit of apc code, the numbers might scare a few, but that's what it deals with on an average web server. So this is how I start callgrind :-
bash# valgrind --tool=callgrind --dump-instr=yes --trace-jump=yes -v \
      /usr/sbin/apache2  -f /opt/php5/etc/apache2/apache2.conf -X

bash# chmod 0666 callgrind.*  /* so that www-data can write to it */

bash# kill -USR2 <callgrind-pid> /* to kill apache2 gracefully */
After running my code, which is actually a bit of php non-code (you know, the ruby-on-rails or J2EE flavour of non-code), generated from symfony, I get a callgrind dump, which I can proceed to analyze with KCacheGrind.
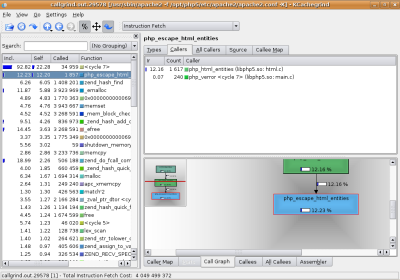
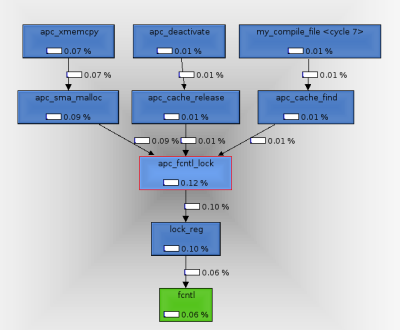
I can then see the call graph, which looks something like this.
The really cool part is when you add the source dir annotations to the corresponding binary files in the configuration. Then I can get something that actually makes sense for a programmer.
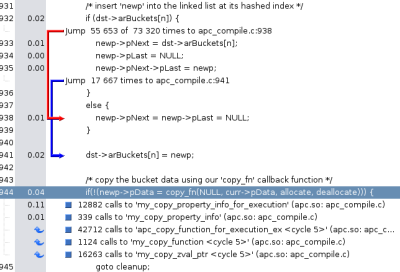
I guess the screenshots speak for themselves. Thanks to this and after moving code pre-computations in place, APC is about 3-10% faster for php 5.1.x .
--You cannot have a science without measurement.
-- R. W. Hamming